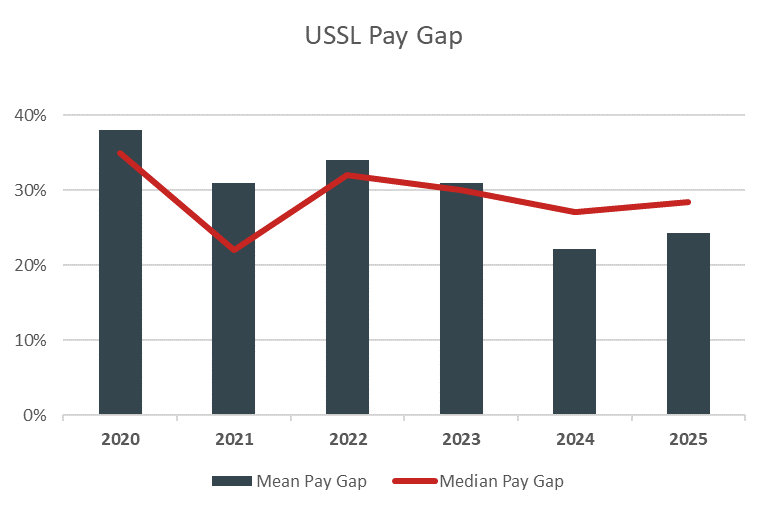
USSL mean pay gap:
April 2020: 38%
April 2021: 31%
April 2022: 34%
April 2023: 31%
April 2024: 22%
April 2025: 24%
USSL median pay gap:
April 2020: 35%
April 2021: 22%
April 2022: 32%
April 2023: 30%
April 2024: 27%
April 2025: 28%
Gender Pay Gap (GPG) reporting requirements provide an opportunity for us and our peers to benchmark the progress being made in addressing this important issue.
The associated legislation requires us to publish data for both Universities Superannuation Scheme Limited (USSL) and for USS Investment Management Ltd (USSIM) by virtue of headcount.
The 2025/26 results shown at the bottom of this page are based on a snapshot date of 5 April 2025.
GPG is based on pay for all men and all women across the USS workforce, and looks at the difference in average (mean) pay of men and women and the difference in the median (the middle number in a sorted list of numbers) pay for each gender, with each difference being expressed as a percentage. So, as an example, a mean gender pay gap that shows a figure of 10% indicates that for every £1 men earn, women earn £0.90. It is different from equal pay, which is about paying the same pay to two people or groups carrying out the same or equivalent roles. Equal Pay is a legal requirement in the UK.
GPG reporting seeks to address gender representation and progression in the workplace and includes six different metrics showing differences between the average earnings of men and women. These are standard metrics that we are required to report on annually for USSL and USSIM as separate legal entities.
GPG is one set of data that helps inform our Equity, Diversity and Inclusion (EDI) strategy – we also have company-wide targets for both gender and ethnicity and we provide overall demographics data to our Executive teams and Boards on a 6 monthly basis. This helps us see the overall picture & inform our Inclusion activities.
The mean GPG has widened from 22.1% last year to 24.3% this year, and the median GPG has widened from 27.1% last year to 28.4% this year.
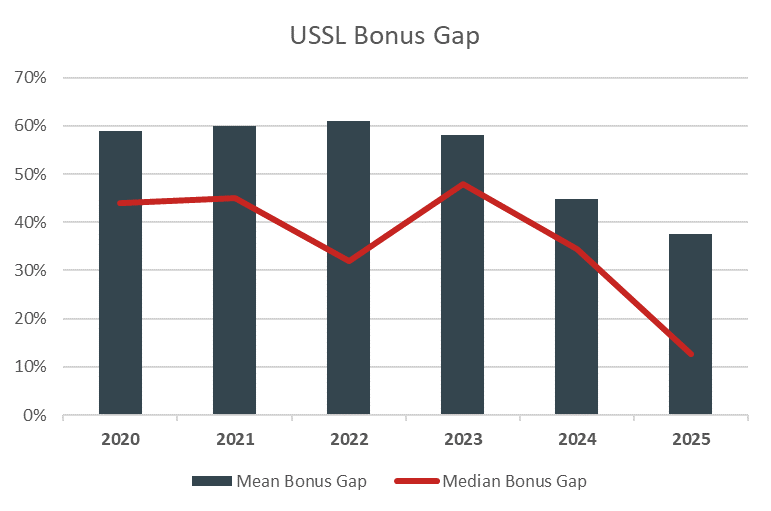
In terms of bonuses paid, the mean and median bonus gaps have narrowed from 44.9% and 34.4% respectively last year to 37.5% and 12.7% this year.
Female employee representation in the upper pay quartile has improved from 38.2% last year to 42.3% this year. However, due to the gender profile of joiners and leavers over the year, female representation has fallen at the upper-middle quartile and increased in the lower quartile. These changes are the primary reason for the widening of the mean and median GPG.
Gender splits across USSL have also changed slightly - 50% / 50% this year compared to 49% male and 51% female last year.
Finally, the proportion of female employees receiving a bonus has increased to 96.5% this year (compared with 91.9% last year), with the equivalent percentage for males remaining broadly the same (91.4% this year compared with 91.5% last year).
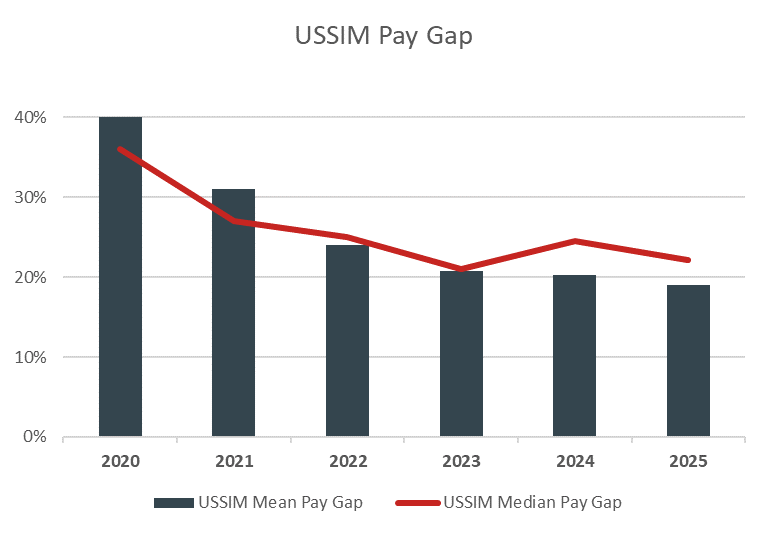
USSIM’s mean GPG has narrowed from 20.2% to 19.0%, and the median GPG has narrowed from 24.5% to 22.2%.
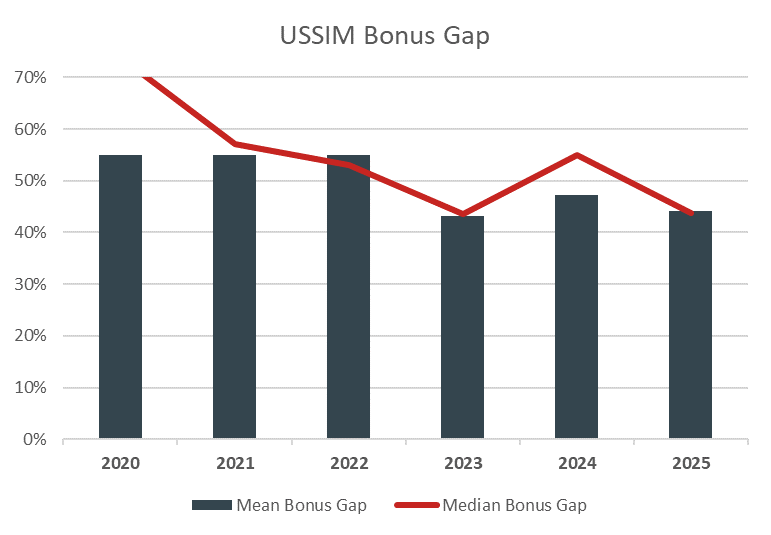
The mean and median bonus gaps have also both narrowed since last year, with the mean gap decreasing from 47.2% to 44.1% this year, and the median gap decreasing from 55.0% to 43.8%.
The percentage of females receiving a bonus has decreased since last year from 96.2% to 95.3%, whilst the percentage of males receiving a bonus has increased from 94.9% to 96.8%.
Gender splits across USSIM have also changed slightly – now 31% female and 69% male compared to 30% female and 70% male last year.
Finally, female employee representation has improved in both the upper pay quartile (from 20.6% last year to 23.5% this year) and upper-middle quartile (from 20.3% to 20.6%).
For both USSL and USSIM, the pay gap is primarily driven by the fact that there is still a greater proportion of men in senior roles compared to women. This also means we have fewer women in roles where the bonus potential is greater.
Due to our size and the level of turnover at a senior level, we can expect a degree of volatility in the data from year to year, which makes it important to focus on the long-term direction of travel. The charts below show that over the longer-term we are seeing a reduction in our pay and bonus gaps.


Embedding Inclusion is one of the four pillars of our People Strategy and we continue to have a strong focus on gender, along with other characteristics such as ethnicity, social mobility, disability and neurodiversity, and LGBTQ+, within our mission to create a diverse and inclusive workplace.
Our EDI priorities work across the colleague cycle to make a tangible impact to diversity and inclusion at USS. Our deliverables represent key actions that aim to attract, retain and develop diverse talent, enhance our inclusive culture, and raise awareness through communication and engagement with colleagues. Recent initiatives include:
Whilst ethnicity pay gap calculations are not currently mandatory for UK employers, we have committed to carrying out analysis of USSL and USSIM’s ethnicity pay gap every two years.
| Mean | Median | |
|
Pay gap
|
24.3%
|
28.4%
|
|
Bonus gap
|
37.5%
|
12.7%
|
| Female | Male |
|
96.5%
|
91.4%
|
| Pay quartile | Female | Male |
|
Upper quartile
|
42.3%
|
57.7%
|
|
Upper middle quartile
|
38.7%
|
61.3%
|
|
Lower middle quartile
|
54.1%
|
45.9%
|
|
Lower quartile
|
65.8%
|
34.2%
|
| Mean | Median | |
|
Pay gap
|
19%
|
22.2%
|
|
Bonus gap
|
44.1%
|
43.8%
|
| Female | Male |
|
95.3%
|
96.8%
|
| Pay quartile | Female | Male |
|
Upper quartile
|
23.5%
|
76.5%
|
|
Upper middle quartile
|
20.6%
|
79.4%
|
|
Lower middle quartile
|
29.4%
|
70.6%
|
|
Lower quartile
|
50.7%
|
49.3%
|
The data in this report is accurate and in line with the government reporting regulations.
Carol Young
Group CEO
Universities Superannuation Scheme Limited