The difference between our expected investment returns and our prudent assumptions
We are currently holding a full valuation to investigate if and how we can expect to have enough money to pay the benefits promised to our members over the coming decades.
To the extent that we plan to rely on investment returns to pay our members’ benefits, the process involves trying to predict how financial markets might perform over time.
As you might expect, this is a common theme in the financial services sector. There is a huge amount of academic literature dedicated to exploring economic and financial theory and reviewing empirical evidence on macro and market factors that influence how and why markets move over time.
But it is important for anyone with more than a passing interest in the 2020 valuation to appreciate the difference between forecasts for expected investment returns and prudent assumptions.
I’ll take each of these in turn.
Firstly, in identifying our expected investment returns, we use a Fundamental Building Blocks (FBB) model. You can read more about it here. We have held ‘teach-in’ sessions with our stakeholders (UUK and UCU), the Trustee Board and the Pensions Regulator to explain how it works and the assumptions we have used – and to answer questions.
The methodology used in our FBB model is similar to that used by a wide range of other asset management companies and is consistent with academic research findings on the drivers of asset returns.
When we compare our expectations with those of other asset managers and investment consultants, we find differences due to underlying assumptions but our results do not stand out as outliers. For example, our modelling is currently somewhat more optimistic than other forecasts about the extent to which future asset returns will outperform liabilities as we expect UK bond yields to rise from current levels over the next 10 years (more on this later).
Our expected investment returns feed into the scheme valuation as one potential version of the future. Under legislation, the Trustee is required to fund the scheme on a prudent basis and the discount rate it sets for a valuation reflects a much broader set of considerations to this end. The Trustee’s Integrated Risk Management Framework can also influence the discount rate.
And, of course, looking at asset values and investment returns alone is only one part of the equation for a valuation. We also need to consider the liabilities: that is, if and how the amount of money we need to pay members’ benefits has changed. (Again, more on this later.)
So, prudent expectations for investment returns are, by definition, not a ‘best estimate’. They reflect a wide range of factors – not just one potential version of the future in isolation.
It is therefore not a surprise that the discount rates set for a valuation differ from our central forecasts.
Neither should it necessarily be a surprise that investment performance will differ from expectations. There is no crystal ball, after all. Expected returns are highly uncertain and, in general, historical returns are a very poor forecast of future returns.
Chart 1, below, illustrates that returns even over long horizons do not follow easily predictable patterns and extrapolation from history is fraught with danger. For example, US equity returns experienced over the past 20 years have been substantially lower than what one would have projected on the basis of the experience of the 1980s and 1990s as a result of the impact of the dot-com bubble and the Global Financial Crisis.
Chart 1: Experienced vs. extrapolated US equity returns over rolling 20-year periods

Note: Experienced returns are returns realised over 20-year periods on annualised basis. Extrapolated returns are return realised over the previous 20 years on an annualised basis. Source: Global Financial Database
And things may not always be as simple as they seem at face value: when it comes to financial markets, it is rare for anything to happen in blissful isolation.
Realised returns have exceeded most forecasts over the past 10 years, particularly for bond assets as few expected bond yields to fall to today’s levels.
Against this backdrop our investment team has – in hindsight – done a good job of managing the scheme’s assets through some extraordinary times for the global economy. Most recently, investment decisions taken since Q4 2019 and in 2020 in response to the COVID-19 shock have added substantial incremental value to the scheme’s assets.
But, alongside this, we must also consider how our existing assets have risen in value in line with market prices.
Here, we can look to the relentless decline over the past decade in the prospective returns offered by ‘risk-free’ assets like government bonds, to perhaps understand why other assets have risen in value (see: Chart 2).
This is in turn driven by the same fall in bond yields which has boosted actual returns experienced by investors in fixed income assets.
When the only ‘guarantee’ offered by the market is a real-terms loss (relative to inflation), it is perhaps not surprising to see that investors are prepared to take more risk in search of reward.
The economics of supply and demand therefore sees ‘riskier’ growth assets go up in price as investors search for higher returns.
Chart 2: Evolution of markets
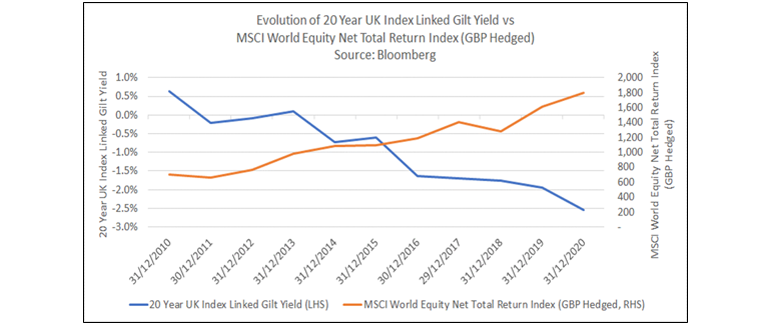
(Source: Bloomberg - UK 20 Year ILG: GTGBPII20YR Corp; MSCI World GBP Hedged: MXWOHGBP Index )
That increases the value of all our existing assets – but it also means the price of the assets we can buy today has gone up and the return (or yield) we can expect to make on them in the future will be proportionately lower.
For example: your house is likely to be worth more than you paid for it if demand for housing in your postcode is now greater than when you were a buyer. But you can also expect the price of the other houses in your neighbourhood to have increased in value too.
If market prices are high today, we might reasonably expect the new market value of your house to be static (or lower) in future. So, while you might make a healthy profit on your current house, you would have to reinvest that profit in order to buy a similar house – and, proportionately, you can expect to make less of a profit in the future (or potentially even a loss).
But, to come back to an earlier point, this is only part of the picture. We also need to consider the liability side of the balance sheet.
For pension funds, the excess returns on assets over liabilities matters more than asset returns in isolation.
Since the 2008 valuation, we have seen the growth in liabilities outstrip the growth in assets on a variety of measures. This is primarily due to falling bond yields (the returns offered by low-risk investments) over the past decade. This is shown at a high level in chart 3 below, which compares the assets at each valuation date since 31 March 2008 with various measures of liabilities over that time.
Chart 3: Historical evolution of assets vs liabilities on various bases at valuations since 2008

Note: These results are provided at the time of each valuation and therefore reflect changes in assumptions and approaches over the period (for example, the ‘low risk’ basis evolves from a ‘gilts+0%’ measure in 2008 to ‘gilts+1%’ at subsequent valuations). The ‘PPF’ results are based on the benefits that would be payable by the Pension Protection Fund, whereas the other liabilities reflect the relevant scheme benefits.
While the 2020 valuation is not yet finalised, we would expect it to show a continuation of the trend illustrated in chart 3.
And, at a very basic level, these are the kinds of challenges we are facing when we come to invest contributions today – and why the long-term outlook for investment returns is lower today than it has been in the past.
Nothing in this article should be construed as an offer, invitation or general solicitation to buy or sell any investments or securities, provide investment advice or to engage in any other transaction or service.