Explaining our central projections for future investment returns
We are currently holding a full valuation to establish how we plan to pay the benefits promised to our members over the coming decades. To the extent we plan to rely on uncertain investment returns, the process involves trying to predict how financial markets might perform over time. Relying solely on ‘guaranteed’ investment returns would be very expensive because of the very low yields available from ‘safe’ assets like UK government bonds (gilts).
My earlier article explained the difference between our expected investment returns and our prudent assumptions. In this article, I explain how the former have changed over the past 12 months – and why.
USS Investment Management (USSIM) has built proprietary models to produce central projections for long-term returns from a wide range of asset classes. These projections are one of the inputs used in the analysis underlying both asset allocation decisions and scheme valuations.
The approach taken by USSIM is based on a decomposition of investment returns into ‘fundamental building blocks’. From a given set of starting market conditions, we apply high-level assumptions for how the building blocks might evolve. We make extensive comparisons between our projections, historical experience and projections from other providers to ensure our analysis and results provide a reasonable ‘best estimate’ assessment. Nevertheless, we recognise that any attempt to construct long-term forecasts is subject to a high margin of uncertainty, so we avoid placing excessive reliance on precise forecasts when building a robust investment strategy. It is also useful to construct alternative scenarios from the ‘best estimate’ and assess their likelihood and investment implications.
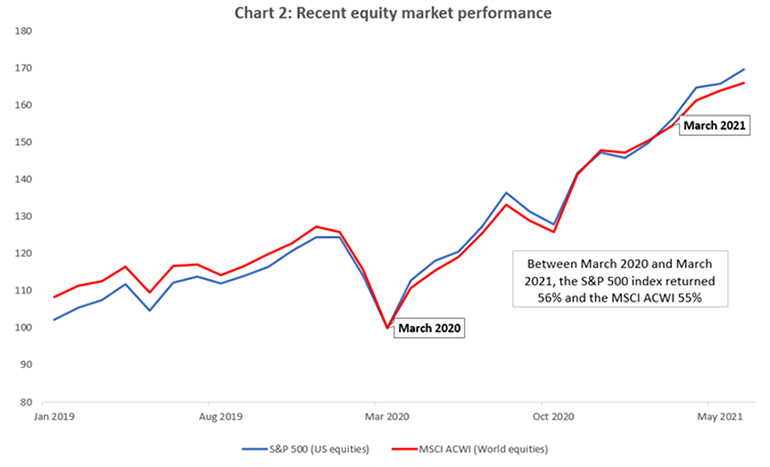
Since the advent of the pandemic in early 2020, financial markets have been on a wild ride. Equity markets plunged in the first quarter of 2020 before staging a remarkable comeback, with the S&P 500 index of US stocks delivering a return of almost 70% since March 2020.
Thanks to exceptional support from policymakers in the wake of the COVID-19 shock, bond yields touched their lowest levels in history over the course of 2020 (10-year gilt yields briefly traded below 0.1% in September 2020). This came in the wake of a relentless decline of nominal and ‘real’ bond yields over the past two decades. However, even bond yields did not manage to defy gravity and bounced back at remarkable speed in Q1 2021 as investors began to discount a more positive economic outlook.
Episodes of wild financial market movements such as this are a feature of the long history for returns, as shown in the chart below, and help to highlight an important point: long term returns are highly variable and depend strongly on starting market conditions.
This is most obviously true for bond investors, where the initial bond yield tends to be a decent guide to subsequent long-term returns.
But it is also true for equities.
For example, an investor who had bought US equities in March 2009 – the lows of the financial crisis – and held for a decade would have realised a return roughly double that of an investor buying equities for 10 years in December 2007 before the 2008 market correction1. Our forecasts and subsequent market movements suggest that March 2020 was an attractive starting point for equity investors, at least relative to bonds, but March 2021 may be less opportune.
The fact that returns realised over decades can substantially change if you shift the start or the end point by a few months challenges the widely held view that equity returns are stable over very long horizons. As you can see in Chart 1 below, even returns realised over 30 years can vary from zero to double digit levels in annualised terms.
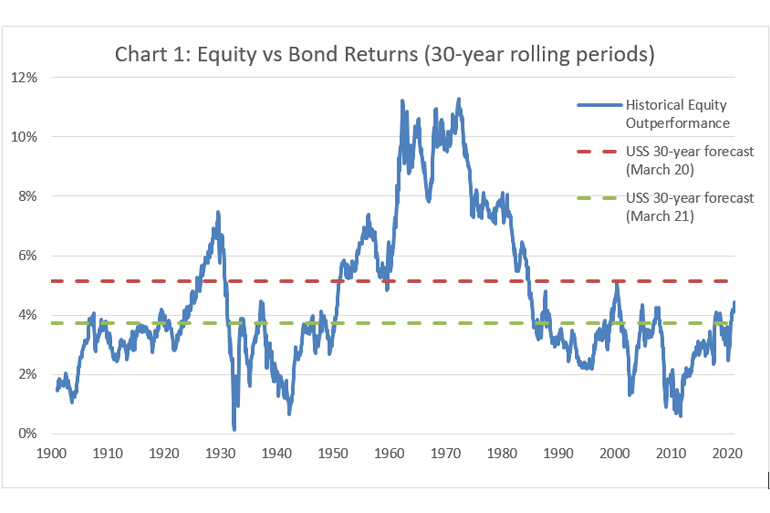
Source: USSIM, GFD June 2021. Note that history shown for US equities (S&P500) and US 10yr Treasury Bonds given data availability, but FBB forecasts are for a broad equity basket.
What is the significance of equity returns relative to bonds? Defined benefit (DB) pension schemes like USS promise members a set inflation-linked income for life in retirement, regardless of what happens to the economy in the future. So, a DB scheme’s liabilities are like corporate bonds: a contractual obligation to pay an income of X in the future “paid for” by a lump-sum received today, which is represented by the value of scheme assets in a DB fund.
We expect ‘riskier’ growth assets like equities to perform substantially better than low-risk, low-return assets like bonds over time. But the estimation of the extent of that outperformance comes with a substantial margin of error. Future returns are highly uncertain. In general, extrapolating historical returns offers a poor forecast.
Bonds represent the ‘price of certainty’. Growth assets can be reasonably expected to produce higher returns than bonds over the long run but there is no guarantee that this will always happen, even over very long horizons.
In March 2020, with bond yields low and equity prices depressed, our central forecasts were for higher equity outperformance over the next 30 years than had been seen in any 30-year historical period starting since the 1960s, despite a relatively weak economic outlook.
By March 2021, our central forecast had fallen back to be slightly below the historical outperformance of the last 30 years (as seen in Chart 1 above), after a good portion of the return advantage we forecasted in March 2020 had swiftly been realised over just one year thanks to global equity returns in excess of 50% (as shown in Chart 2 below).
From this perspective, March 2021 saw relatively ‘normal’ market conditions.
What about outright returns, which are more important for future pension contributions? How do our forecasts compare with history? We’ve looked at the expected outperformance of equities against bonds, which has fallen since March 2020 from strong to relatively typical levels. But in outright terms, our forecasts for both bonds and equity returns are now well below historic averages.
As mentioned, for bonds the starting yield tends to be a reasonable guide to future returns. Both in March 2020 and in 2021 bond yields were well below historic averages, which implies historically low outright returns for bonds – indeed future returns are likely to be negative after adjusting for inflation.
For equities the picture is more complex, but it is likely to be related. Despite forecasts for reasonably strong outperformance against bonds both as of March 2020 and as of March 2021, our return forecasts for equities were also below historic average returns. A combination of slower trend growth, relatively high corporate profit margins in sectors like technology stocks and elevated valuations (i.e. prices relative to fundamentals such as earnings, dividends or cash-flows) - arguably made possible by low interest rates - results in forecasts for equity returns that are low relative to history.
For a diversified portfolio across equity and bond assets of the type held by USS, this implies that future returns are likely to be below historical averages. Most other industry forecasters have reached a similar conclusion2 . Even Prof Dimson, Marsh and Staunton, who authored The Triumph of the Optimists in 2002, have pointed out in their latest yearbook3 that Generation Z is likely to experience much lower equity and bond returns than previous cohorts like Millennials and Generation X.
The future is unknowable. We are ultimately debating the ‘right’ answer to an unknowable question at a time of significant uncertainty. Could we all be wrong? Absolutely. It is certainly possible to depict a more positive scenario for equity markets. COVID-19 may represent a turning point in the global economy leading to a strong acceleration in the adoption of disruptive technologies, which in turn might lead to three ‘roaring’ decades of productivity gains. Equities would likely outpace bonds by a substantially larger margin than our ~4% ‘best estimate’ if this dynamic plays out. On the other hand, it is also possible that the build-up of inflationary pressures and policymakers’ action favouring a redistribution of the economic pie from capital to labour could lead to a very challenging environment for corporate profitability. Against this backdrop, equities may actually deliver a much lower outperformance than our ‘best estimate’ forecast, as has happened a number of times over the past 50 years.
So, there are risks – both upside and downside – to consider, but we believe our ‘best estimate’ provides a plausible assessment of equity and bond return prospects over the coming decades.
1 The US equity market realised a 15.9% annualised total return in the 10 years from March 2009 whereas over the 10 years from December 2017 it produced an 8.5% annualised total return (Source: Bloomberg)
2 For example JP Morgan Asset Management https://am.jpmorgan.com/gb/en/asset-management/adv/insights/portfolio-insights/ltcma/ and BlackRock https://www.blackrock.com/institutions/en-gb/insights/charts/capital-market-assumptions
3 The Global Investment Returns Yearbook 2021: https://www.credit-suisse.com/ch/en/about-us/research/research-institute.html