Cost and value for money in USS
Value for money matters at the best of times but, with rising inflation and conditions in financial markets making defined benefit pensions increasingly expensive, it is more important than ever to ensure that USS is run in a cost-effective manner.
Every penny we spend managing the scheme and its investments is drawn from the fund we are working hard to build to pay members’ benefits. So, it is central to our role in managing the scheme that we keep tight control of costs.
Investments
In the last financial year (2020/21), total scheme costs were £273m with the cost of managing scheme investments representing 83% of that (some £227m). The remaining cost was spent working, with employers, to support members up to and through their retirement.
One of the ways we assess if we are managing our most significant costs efficiently is to look at how we compare with our peers – that is, funds of a similar size and scale.
CEM Benchmarking is an independent company working in the pension sector that benchmarks costs between peers every year. Participants’ reported costs are adjusted to harmonise cost treatments and, as far as is possible, provide like-for-like comparisons.
Focusing first on the significant majority of our spending, our investment costs are £60m, or about 25%, a year lower than the peer median based on CEM Benchmarking's latest analysis.
The key to achieving this is the way we have, over time, built up the capability of our in-house investment team. This approach comes with a corresponding increase in headcount and staff costs but, for a scheme of our size, it is demonstrably less expensive than paying the rates charged by commercial investment managers.
Of the £227m spent on investment management in 2021, £139m was incurred by external managers and only £88m was internal spend, despite roughly 70% of assets being managed internally. That comparison is arguably unfair as some of our outsourced assets are in specialist private assets, which are expensive to manage. This is, however, balanced to an extent by the way we outsource the management of our passive investments, which are (in contrast) the cheapest assets to manage. Overall, given the scale of our assets and the complex investment and risk challenges that the scheme faces, the numbers show it is cost-effective for us to manage large parts of our assets internally. Our ability to do that is the key driver of our performance against the investment cost benchmark, noted above.
In terms of the associated staff costs, the ‘market rate’ for highly skilled investment management and financial services staff is higher than in many other sectors. We want to ensure our complex investment and risk challenges are properly managed, but as a rewarding and interesting place to work we don’t pay over the odds to attract and retain staff. We use an external specialist compensation adviser to compare our pay levels each year with the wider market to ensure we maintain that balance with our value-for-money objectives. We are open about the amounts we pay and publish these each year in our annual Report and Accounts.
We continually look to optimise what we do. We have over the past two years largely disinvested from hedge funds, saving over £20m a year, as we did not believe that the potential investment performance contribution merited the cost involved. We have recently replaced third party fixed income investment managers with internal mandates and are partway through redesigning our equities strategy in no small part to assist with the achievement of the scheme’s Net Zero goal. These decisions have resulted in substantial savings, including £7m a year in equity research costs as well as the save in hedge fund fees noted above.
And the end result, when we look at investment costs as a proportion of the assets under management (one basis point, or ‘bps’, amounts to 0.01% of the value of the assets), is an ongoing downward trend (interrupted briefly in 2019/20 by Covid-191).
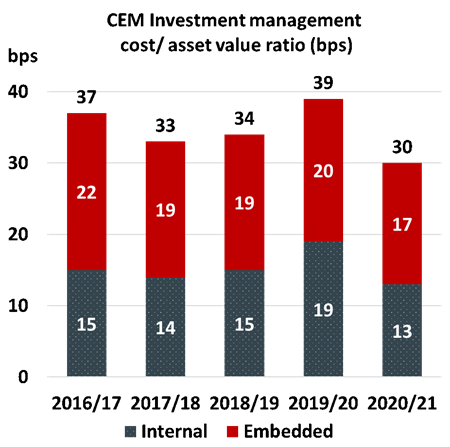
Depending on future asset growth, that downward trend may moderate or even reverse to a limited degree over the coming years as we:
- focus on our plans to achieve our Net Zero ambition and our ability to measure our progress.
- increase leverage in the scheme in order to improve our management of inflation and interest rate risks whilst maintaining a high level of return-seeking ‘growth’ assets.
Pensions
We also benchmark our performance on pension service levels and related costs which make up the remaining 17% of our costs (using the same CEM Benchmarking service as for investments). These costs relate to pension processing, support services for members, and other important pension administration activities (such as scheme governance – which includes the functions of the Joint Negotiating Committee as well as the trustee, actuarial scheme valuations, and communications). The evolution of pension costs, measured as an annual cost per scheme member, is shown below:
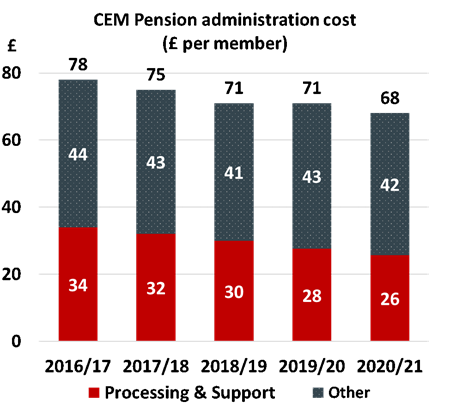
Whilst the trend is downward and the costs are much lower, the overall benchmarking picture is more mixed here than with the scheme’s investment costs.
Our processing and support costs are roughly in line with the peer group average2 (£26 vs £24 peer average). Our service levels on member enquiries and transactions, and our online capability are assessed as being above our peer average.
We are more expensive than peers on the remaining governance, scheme valuation and communications costs that make up 10% of our total costs.
It is worth noting that the pension cost benchmark group is drawn from a small number of UK-based pension schemes that are quite varied in size and nature including closed and single employer schemes. USS is somewhat unusual as a private scheme serving a large number of employers, with defined benefits open to new members and to future accrual, coupled in a hybrid arrangement with defined contribution benefits.
Our costs in this area have been impacted by the complexity and thoroughness of our scheme valuations and associated supporting stakeholder arrangements as the scheme has been confronting the difficult issues raised by the last few valuations.
Given the relative materiality of each cost type, when all the costs are taken together, we are demonstrably delivering value for money compared to peer organisations. But we will continue to focus on driving further efficiencies in future.
I recently covered the points above in a bit more detail in my presentation to our annual Institutions’ Meeting. The meeting also featured presentations from Dame Kate Barker (Chair of the USS Board), Bill Galvin (Group CEO), Helen McEwan (Chief Pensions Officer), and Simon Pilcher (CEO of USS Investment Management), as well as a Q&A session with the audience. You can watch a recording of the whole meeting to hear more about our purpose, performance and priorities, and how we’ve maintained high standards of service for members and for our sponsoring employers.
1 This is explained on Page 54 of the 2021 Report and Accounts
2 CEM Benchmarking reports peer average in its Pension Administration report rather than median as used in its Investment report.